 A lot of the activities I have talked about on this blog, or the ideas I talk about, are generally ones I have put significant time into. The activity I am talking about in this post has been a very successful one for me over the last few days. I would like to say that it was because of the careful and deliberate planning I did on the task prior to the lesson, but that would be a lie. Sometimes as the lesson is unfolding you see an opportunity present itself, and by following it through, sometimes planning the next step on the run, you can have a really good lesson. Planning the next step on the run was not a result of being disorganised, but a result of identifying an emerging need and recognising the need to follow up on it before moving any further.
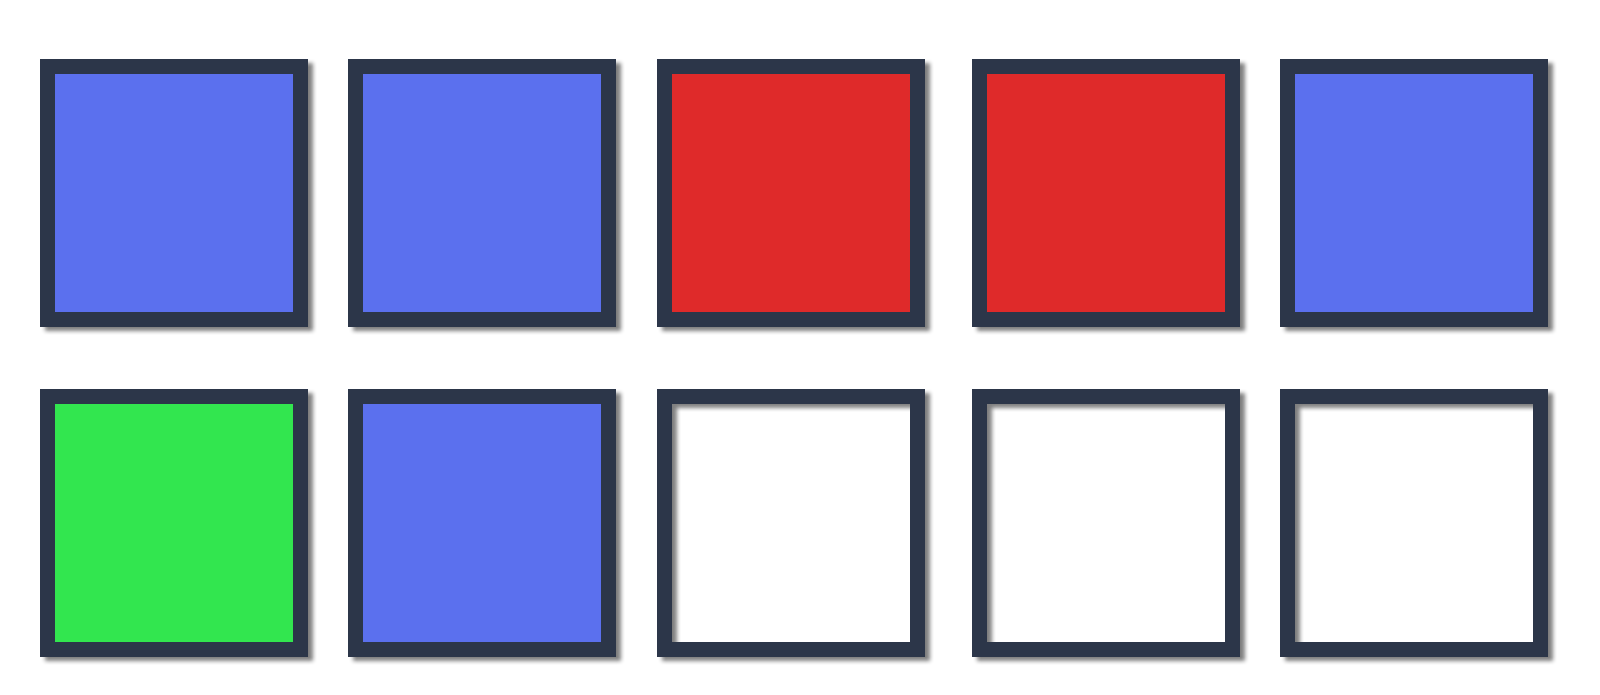
They then had a conversation with their table groups about what they thought would be the colour of the other 5 blocks. Not surprisingly all the responses were some combination of red and blue blocks, however despite knowing that there were lots of other colours of blocks in the storage tub, they had not considered they could be part of the final five.
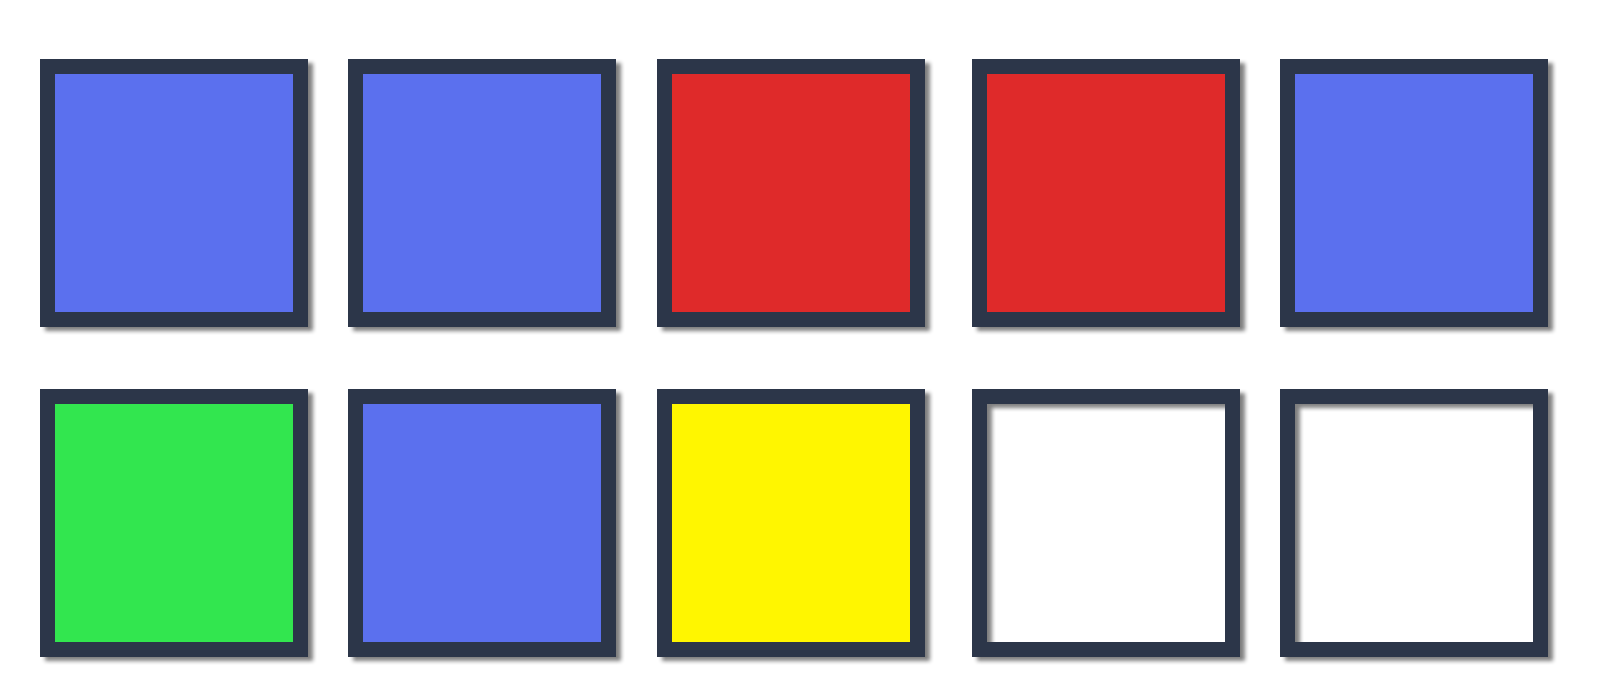
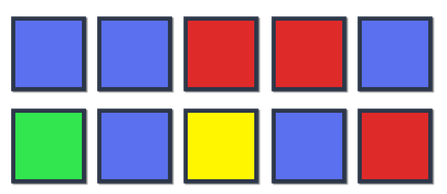
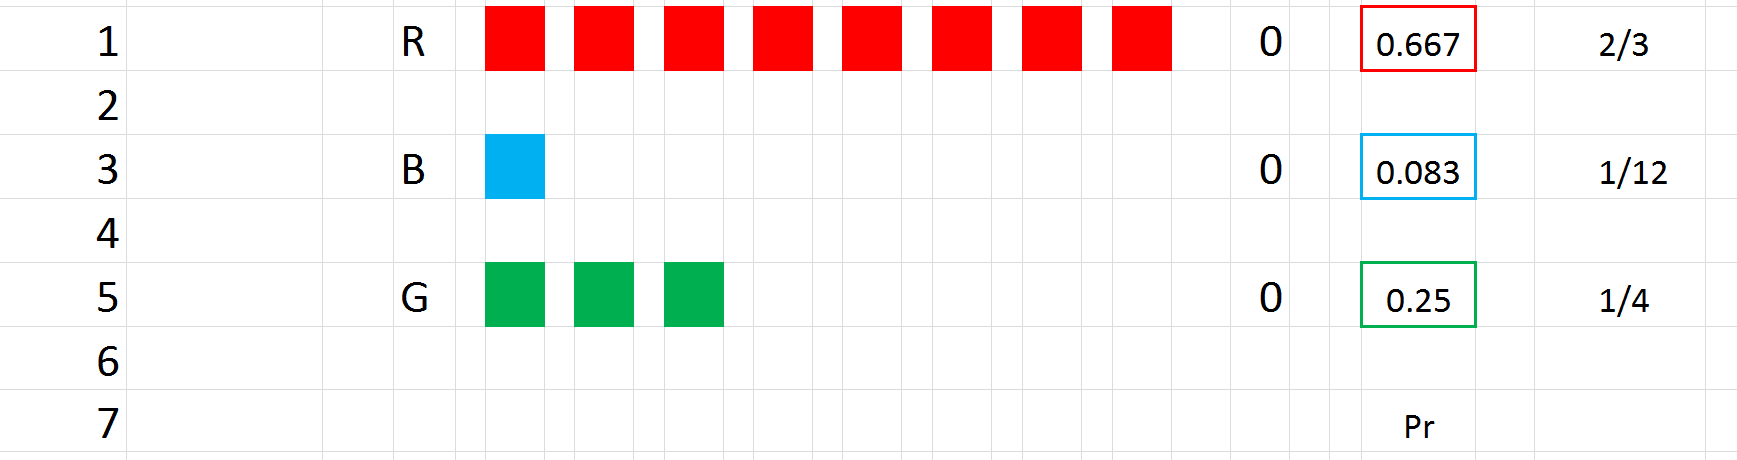
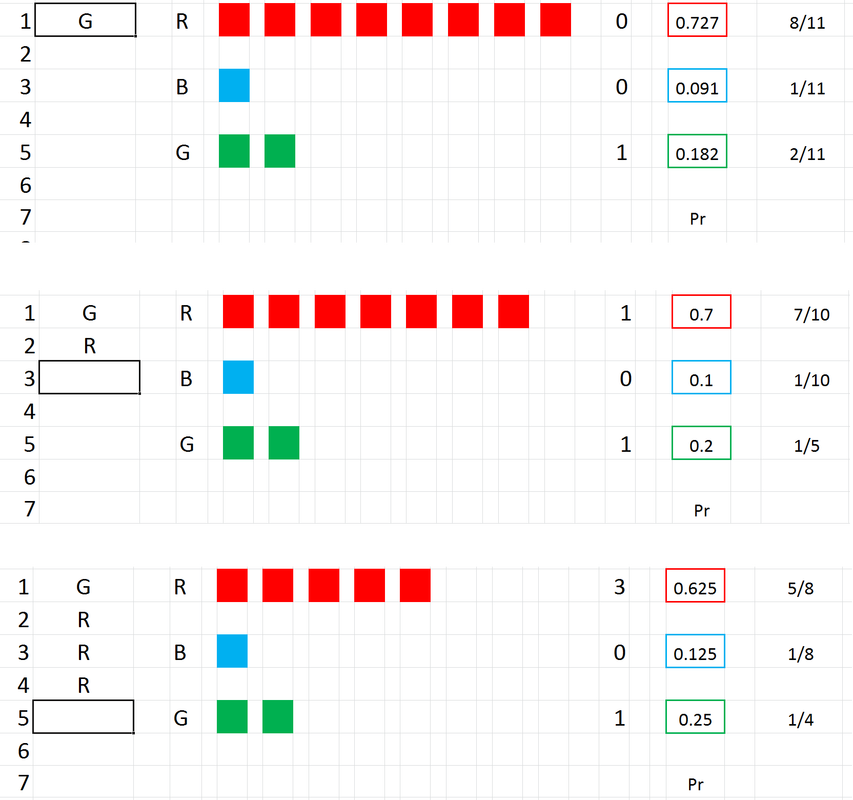
Next I wanted to introduce the idea of using probabilities to describe exactly what is in the box so I gave them the information listed below and then gave them the time in groups to have the discussions required to figure it out I have filled the box now with blocks according to the criteria below, can you tell me how many blocks of each colour are in the box? What was exciting about seeing them work on this was that I finally saw the classroom culture that I have been trying to build all year with them. In working together on the problem they were talking about the problem, they were critiquing each other's reasoning, they were asking questions of each other, they were willing to tell the group when the explanation still didn't make sense to them, forcing the person giving the explanation to justify their thinking more strongly. I think one of the most important aspects of their work though was their confidence with their answer. With these sorts of questions when they tell me they have the answer I try to ask a few questions to head their thinking down a line that creates some doubt that they have found the answer. This isn't done to trip them up, but is more designed to see if they have got to a point where they feel the have considered everything and have come to the only answer that works, to gauge their confidence in their own thinking. Normally when I ask students a question about their answer they take this as an indication that their answer is wrong, but this time, no matter what question I asked them about their answer they had confidence with it as they had determined that 12 was the only possible number of blocks as you could not have parts of blocks. The next day the aim was to move towards students being able to determine how to calculate the probability of pulling a block of a certain colour out of the box, to help facilitate this i made up a simulation of the box compostion from the previous day using excel. The excel file and a screen shot is shown below.
Like the day before i got students drawing the blocks from the box and this time we tracked the probabilities. when the first green block was drawing I asked them to predict what would happen to the probabilities of each colour.
Overall what started as a sidetrack, developed into some really great thinking, on some really important concepts and I couldn't be prouder of that lot today.
0 Comments
When students think about presenting their solution to a mathematical problem visually I get very excited because I find those visual solutions hard to generate myself, I am getting better it, but I don't see the mathematics in that way when I am solving a problem generally, I get too wrapped up in the equations in the formal mathematical notation. The reason I get excited about those visual representations for a problem is that they often are much easier than the formal mathematics and they lead to some great mathematics. The other day I did a task with my class that I got from Professor Peter Sullivan from Monash University who I had the pleasure of working with once per term for three previous years in my work as a numeracy coach. The question is as follow
I like this question on a range of levels
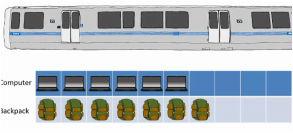
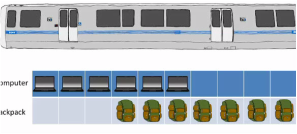
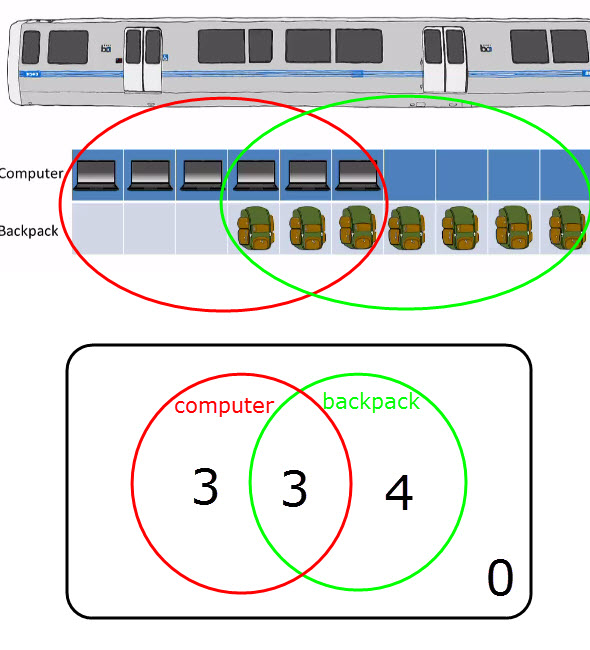
One of the groups working on this task came up with the solution shown below, it has been altered from the original (which was just dots showing the same information) but the same thinking was there. They first started by looking at the 0.7 and 0.6 and converting them to 70% and 60% which they then turned into 70/100 and 60/100 which simplified to 7/10 and 6/10. From this they reasoned that ten was the minimum number that could be on the train. From here they attacked the main part of the problem by first assuming that there was as much sharing as possible, making sure everyone with a computer also has a backpack. This gives six people having both items, this is shown by the image below on the left. They next thought about orgainsing the same but with as little sharing as possible, by making sure everyone who didn't have a backpack needed to have a computer. This scenario gave the image on the right below, an overlap of three. Hence they gave a range of answers as being between three and six out of ten people.
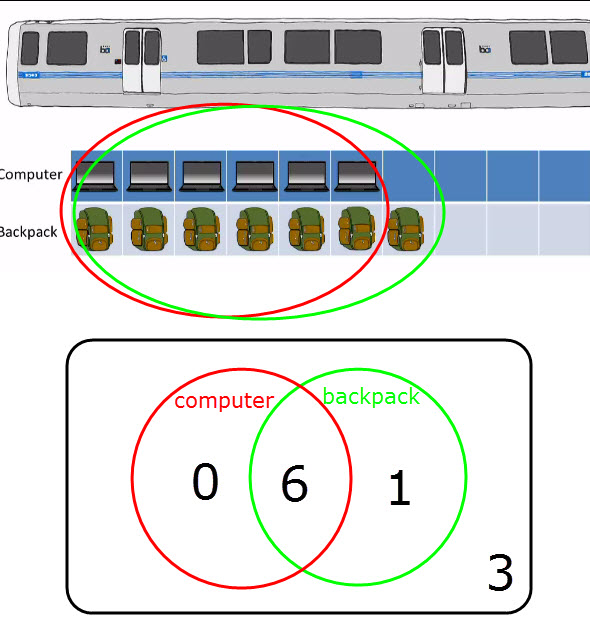
The animation below shows they range of answers with more clarity What occurred to me as I was documenting their thinking on the board is how nicely this representation led into the intended purpose of the lesson, Venn diagrams and two-way tables. Simply by circling the laptops in one colour and circling the laptops in another I had generated a fairly accurate Venn diagram as shown below. You could clearly see in each case how many were in the intersection of the two sets, how many belonged to only one of the two sets and how many were outside of those two sets.
What I really liked about this is now easily it made the transition to Venn diagrams and two-way tables. from our initial starting point of probability of simple events.
Sometimes ideas for lessons get away from me and take me to some unexpected places, and sometimes the reaction of classes to those lessons are also unexpected. I was thinking about a lesson idea for circumference and I thought about a lesson I saw once from Andrew Stadel (lesson link here). Where he wanted students to determine how many rolls of tyre it would be for a tyre to hit a target, I liked to lesson but was not sure how my students would "buy in" to the task. I wanted to redesign the task a little to give students a greater reason for getting into the maths. Like with many of my ideas I ran it past a teacher at the school that I often collaborate with on tasks such as this and we came up with what I think is an interesting alternative to that original task. The Task Students had to determine where on the ground they were going to put a chocolate frog so that it met two criteria:
The twist with this task was that they were only allowed to use 1 item from their bag to measure both the tyre and the distance on the ground. 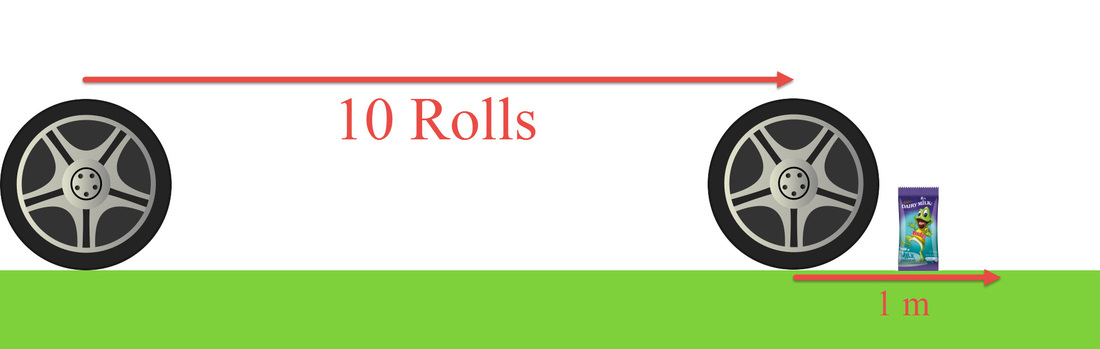 In relation to this task I think there are three incredibly important aspects to it. Firstly is that they really have to think about the positives and negatives of anything that might be in there bag in relation to it's use as a measuring device, there was nothing in anyone's bag that could accurately measure the circumference of the circle in one measurement so they had to think about aspects such length, flexibility and having actual measurements on the device. Secondly was the idea that the criteria and the restrictions I provided made the task of achieving it quite difficult, Using something that was not ideal as a measuring device meant that there was going to be inherent errors in the way they could possibly measure the tyre. They had to be very accurate in what they used as the measuring errors could compound quickly as they measured both the tyre and the ground.Finally there was a high degree of ownership over the task as they seemed to really want to be able to not have a squashed frog. That little element of competition was very valuable in this task, That element of competition I have found to be very useful in a range of tasks I have done previously. The Approaches and Challenges The range of measuring devices people used to measure the tyre was quite interesting. Most chose their ruler from their bag to measure it. However since the ruler was only 30 cm and the tyre was significantly bigger than that both in circumference and diameter they needed to make lots of measurements and therefore compounding any measurement errors. Most were also using a rigid wooden ruler to measure a curved surface which made the measuring more difficult again, some had a more flexible ruler that they could wrap around, but some of the compounding errors remained. Many of these students decided to use a ruler as they could then stick within their comfort area of standard units of measurement. Others chose to use headphone cables as measuring devices, they found them to be much more flexible and longer than the rulers, therefore they could accurately follow the contours of the tyre and it was long enough that the measurement errors were not as significant. However they seemed to encounter difficulty when dealing with lengths that were not quite a full headphone cable length. They were not sure how to figure out what fraction or proportion of the headphone cable was left over. When Introduced to the idea of folding the headphone cable to figure out how many parts were used they found this area. For example in the image below if they measured the tyre and got a total diameter of the blue part of the line below, they could fold it as shown to give an approximate length of just over 3/4.  The other part of this that students seemed to find challenging is using headphone cables as a unit of measurement in a mathematical formula. The seemed to have this impression that the formula for circumference of a circle would only work if you were working in standard units of measurement. They didn't realise that If you said that the diameter was 3/4 headphone cables then the diameter would be 3.14 x 3/4 = 2.36 headphone cables. This however was not unexpected, in mathematics we get so used to dealing with measuring devices with standard units of measurement that we do not often realise that sometimes the non-standard units of measurement can be just as valid and just as accurate.
Some of the students who engaged in the task a little more strategically came up with multiple ways to measure the tyre using the same device. The measured the circumference directly, but then they also measured the diameter and used to formula to determine the circumference, where there was significant differences between the two values they took measurements again to verify their results and if they were accurate then they had some discussion about which of their measurements they felt was more accurate. They realised that a discrepancy of 3 cm was not much but when you multiply it over 10 rolls you have just potentially lost a third of your target area. The final challenge most of them faced was where to place the frog because that question is not as simple as it seems. If you put it too close to where you think the tyre will finish and your measurements are off then your frog will get squashed. Conversely if you put it close to 1 m away from where you think the tyre will finish and your measurements are off then you could be outside the target range. Most people put it closer to the tyre and a few put it closer to the end of the 1 m, very few considered putting it where they thought of the middle of the range may be which in my humble opinion is where I would be aiming. The Results Overall when we rolled the tyre the level of excitement was high, they were all keen to see how their calculations faired. Of the 8 groups that placed frogs down 1 group was more than 10 rolls away but outside the 1 m target range, four groups had their frog squashed (but by less than 15 cm) and 3 groups met both criteria. They seemed to really enjoy the activity and everyone got to eat the frogs at the end. I am so proud of the kids I teach today. Since the start of the year we have had a much stronger focus on patient problem solving than they might have been used to in the past and until today there has been a lot of resistance to attempt some of the tasks. But today they were superstars, it is the first time where almost all of them had persisted in solving a problem, even when they found it difficult. There had been pockets of this in the past, but to see most of the class doing it today was fantastic.
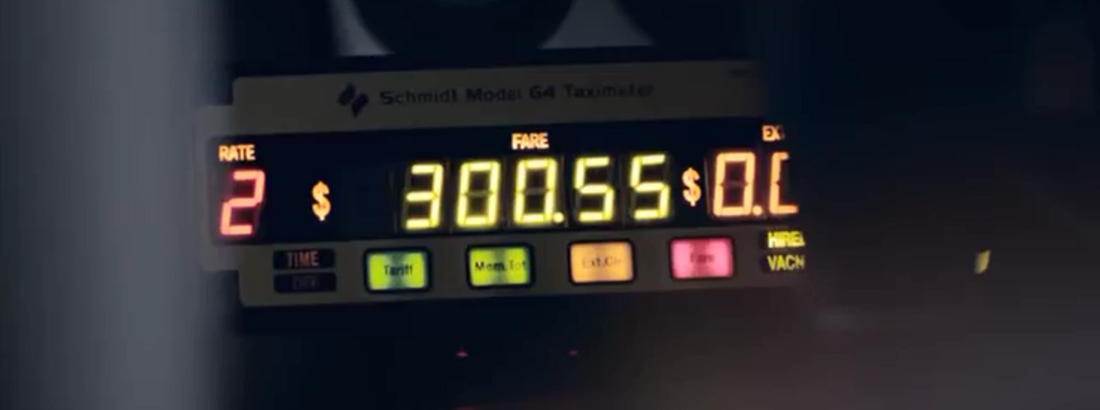
The lesson that we decided to look at was based on an ad produced by the motor accident commission in South Australia. The idea behind the lesson, which they came up with at the start, was to find out how long they were actually in the back of that taxi. For the sake of trying something a bit different we combined three maths classes with three maths teachers to see how it would go. Students were then asked to generate some ideas about what is the sort of information that they might need to know to answer the question and they came up with
From here they need to have some information in order to be able to progress forward firstly was how they calculate the taxi fares. Students were given the formula below, but were not shown how to use it at all. Cost of the fare = Distance cost + Waiting Time Cost + Flagfall
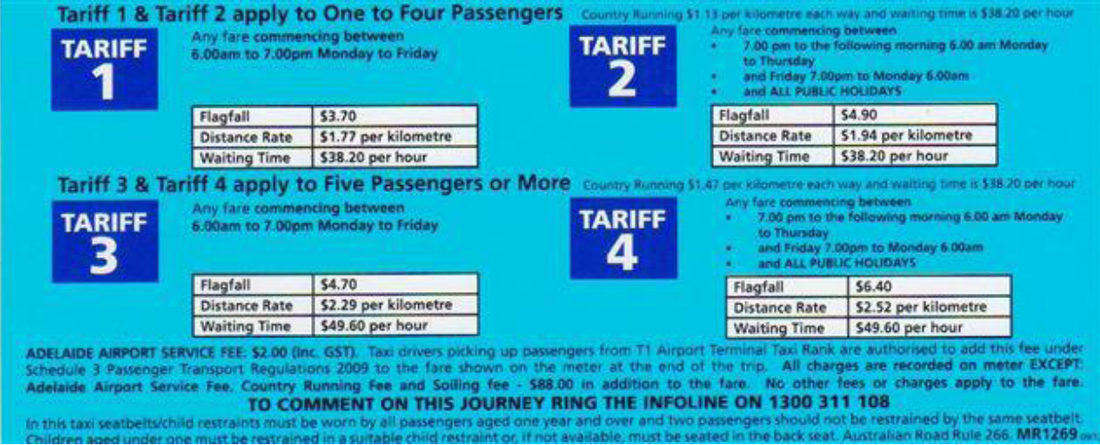 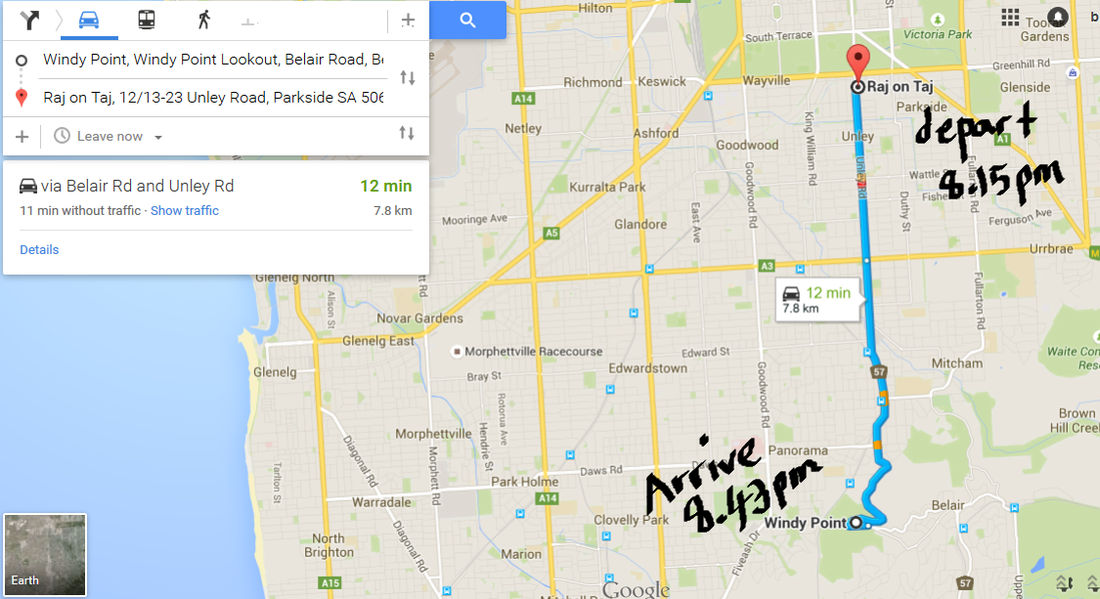 It was great to see how students had made the decision that they needed to compile information from several sources realising that they needed to use the time of departure to find out what tariff they would use and then using the tariff information to relate back to the distance traveled. This continuous movement between different sources of information was really great to see. The path they took from this point was pretty different with each group. some were able to work through it themselves and some needed some further prompts, but very few actually gave up on the problem. Even when they did not have much success initially they really took on the prompt and tried to incorporate it into their thinking and that is why I am so proud of them today.
It is always a little nice when I still find some of the answers I get for questions I give to students surprising. It is not that the answers are unexpected, it is more that sometimes I get excited by the solutions. A local supermarket chain on and off for the last few years has been running a bit of a promotion. The promotion involves a series of 108 animal cards. For every $20 spent at their store you get a pack of 4 animal cards. I have a three year old daughter who loves these cards. She loves collecting them and seeing which ones we have missing. I know that over the course of the promotion we have collected a lot of cards and have got a lot of doubles, it got me wondering how many cards I would need to collect (doubles and all) to collect the full set of 108.
and sometimes less gaps, but the 20 represents the average number of cards missing. At 400 cards the average missing drops to about 2, a substantial gain in cards. However at this point you have spent $2000 dollars at their store. In running the multiple simulations of the 400 cards there was only one or two occasions out of the dozens of times tested that I managed to get a full set of 108 out of the 400 cards.
Raising this again to 600 cards there is still a gap. about a third of the time there was a full set cards, but in two thirds of cases there was an average of one card missing, it was only when taking the number of cards to 800 that we began to consistently got a full set of cards. At 800 cards you have spent $4000 in their stores. Having to spend $4000 to in a sense guarantee a full set of cards that probably cost them less than $5 to produce is not necessarily something that sits well with me. Part of the money generated is being used to support a few zoo's, so it is not so bad. In reality people will swap cards with other people to fill the gaps, and they are likely to spend this money any way, they are not doing more shopping just to get cards. However if the parents of these children used to shop at another supermarket chain, then the introduction of these cards. if only for a short time, has no doubt swung quite a bit of business their way. These were the sort of discussions that were so valuable in conducting this task with the class.
the other way we try and make the work relevant is by linking the work to their interests using things such as sport to calculate statistics and optimal angles, but due to many students dislike of mathematics quite often what comes back is "why are you trying to ruin football for me my making it into a maths lesson". They enjoy the sport and playing it, but don't want to know about the maths involved.
The argument about relevance also becomes about who it is relevant to. If you make the lesson about football, then it is not personally relevant to anyone who does not like that sport, this could easily be more than half of your class. The idea of relevance can be used very successfully for engagement, there have been some highly relevant lessons that I have taught, that students have also found highly engaging. But I have also had some highly relevant lesson fail miserably. Over the last few years I have found that embracing the idea of presenting students with ridiculous problems has increased student engagement more than anything else. So how do I define an ridiculous problem
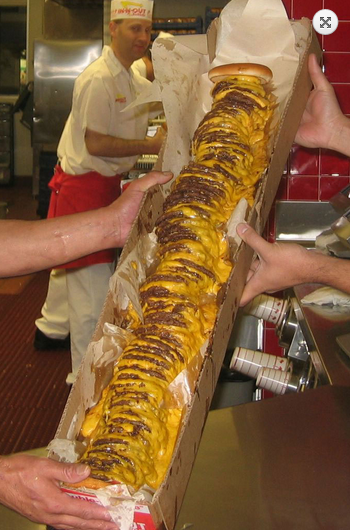
Some of the questions of this type I have had success with in the past are as follows
All of these questions immediately gained the students interest, the looked at me like I was insane, but also had that look of "I want to know the answer to this". As can be seen they are all very much related to something they have seen before, money, burgers, post-it's nuggets but it takes how they have thought about these things far outside the realm of what we consider "normal". It is this deviation from the normal that students find really interesting and the work they have produced on these sort of tasks has been quite stunning. In my observations of students working on these type of tasks it is clear that they are discussing the work more with others, coming up with stronger, well reasoned responses and also add value to the task for looking at ways they can extend it such as looking at how many calories in the 100 x 100 burger or the cost of a 1000 x 1000 burger. In particular the chicken nuggets question still continued to have students talking about it 8 weeks after the task had finished, students even went to McDonalds and tried to order that number of nuggets to see what they would say. |
Senior Leader of Pedagogical Innovation and Mathematics Coordinator in Regional South Australia.
DisclaimerOpinions in this blog are my own and do not necessarily represent the views of my employer. Archives
August 2019
Categories
All
|
|||||||||||||||||||||||||
 RSS Feed