|
Algebra seems to be an area of mathematics that really makes kids anxious, just saying the word often results in a collective groan from the class. I think it is mostly because kids see it as being a lot more abstract and disconnected from everything else they have done in mathematics, they see it as just shifting symbols around the page so for a number of years I have been using Fawn Nguyen's Visual Patterns website as a starting point for their journey into algebra, I find that it really takes the fear and anxiety away from algebra. The kids arrived at my lesson today on the first day of term, I stood outside to class in the common area to greet them. They asked if they can go into class, I told the "no we are staying out here", they asked what we are doing and when I told them algebra the groans went up almost in unison. It always happens, most kids seem to hate and fear algebra, so my first step is to attempt to take that fear of it away by showing them that it is not really as daunting as they think it will be. I can understand why they fear it, in my experience algebra has always been a topic that teachers feel the most need to teach from a proceedural base, they find it harder to develop conceptually. Algebra becomes about moving numbers and symbols around a page rather than really getting into what it is about, patterns and relationships. I started by isolating one table in the common area and asking them how many chairs they feel would fit comfortably around it to which they replied 4, I then put two tables together and asked again and then three, creating the pattern below. When I moved these tables I intentionally moved the chair on the right out of the way, joined the next table on and then moved that same chair back to the right to help develop the idea of a constant (left and right chairs) I then brought two additional chairs in to put on the top and the bottom to help develop the idea of the rate of change and also how the pattern is growing. 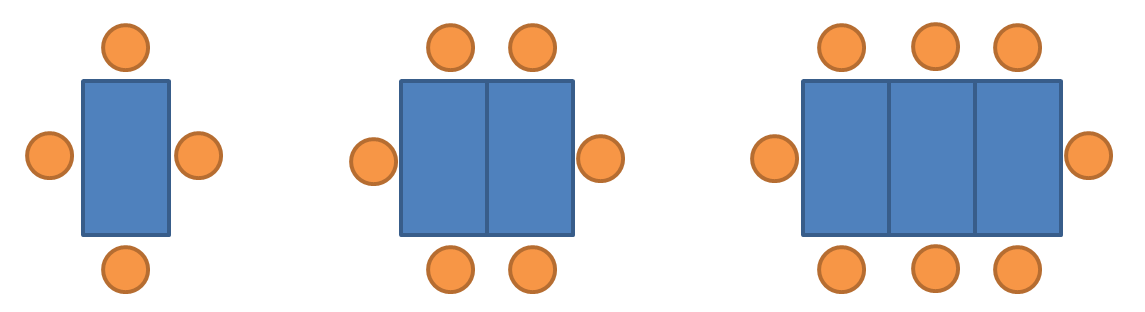 As a starting point they were then asked to predict how many chairs would be around 4 tables and the quick answers provided were 10 and 11. When there was not agreement, rather than telling them what was correct, giving them a few extra minutes to discuss which was correct was enough to bring them all to the same thinking. Just giving them the time to stop and think, and to refine their original quick thinking has been valuable, they often answer quickly looking for me to give them the answer rather than taking the time to think more carefully. After settling on 10 as the answer for the 4th in the sequence their work for the task was to answer two questions.
The questions are very closed, but intentionally so, this was their first lesson on algebra and they had not seen questions like this before to the aim was to build my starting point, to see how they approached it, to see how I could build their intuitive understanding of the pattern into a deeper understanding of the concepts that sit behind the pattern. This is a task I could hook all of the learning on for the rest of the topic. With limited or no input from me they were away and the approaches varied, but the three that were most prevalent were the ones that I have shown below 
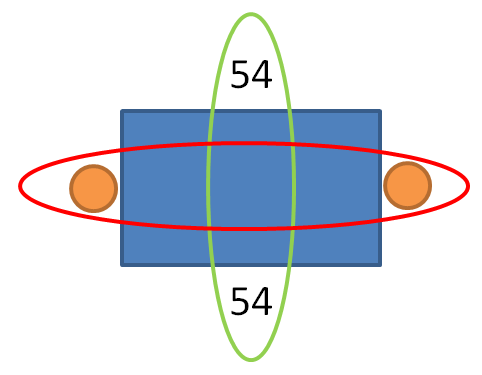
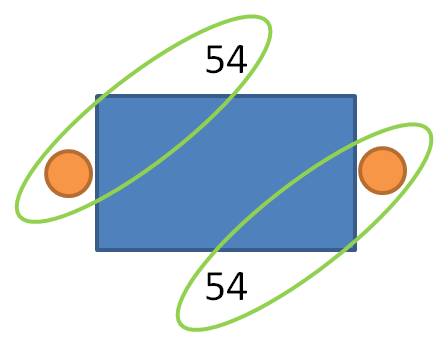
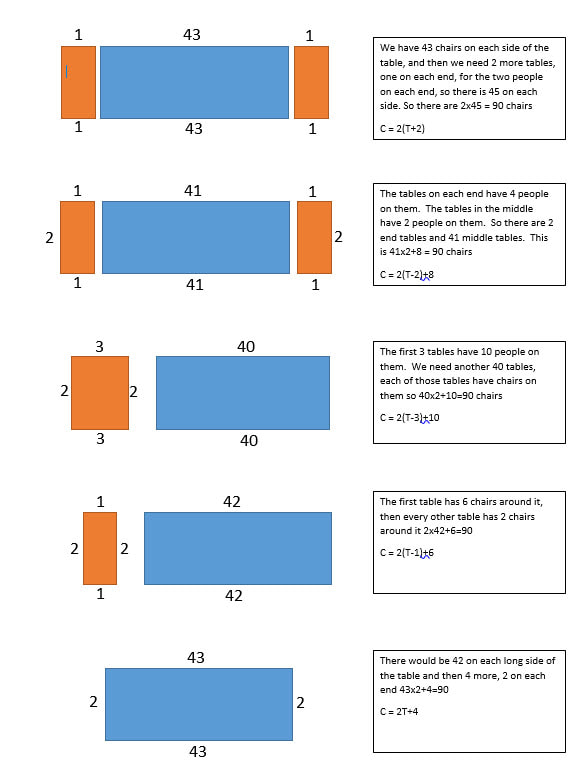
Some had attempted to draw the 54 tables and tried to count the chairs, and that is fine it worked for them. They hadn't noticed a pattern from the first three, but what drawing them all out allowed them to do is to recognise that they could then simplify their picture to one of the ones below it. The processing of drawing them all was the light bulb moment they needed. The thinking needed to be captured and shared, but it also needed to be refined, I wanted to take their thinking, which they were happy with but to them did not represent the algebra they were used to seeing. I wanted to show them how they thinking they were doing, was thinking algebraically and how we could transform their thinking to that more pure algebraic form by showing them how their thinking can be turned into the notation they were used to seeing. The image below shows the process it took to do this  It started with their visual models and their calculations. As they talked about how they did it we recorded their words. We started a process of removing some of the words that they felt were not necessary in describing the pattern. By also substituting some words for symbols and then substituting other words for pronumerals they were able to refine their inital thinking down to an equation . The equation made sense to them as they could see with much more clarity how their thinking was represented in that equation, that equation was no longer a daunting and unfamiliar thing. This process was repeated with the second of the two questions, but unlike the first question, there was a great deal of disagreement about the answer. In order to arrange 238 tables we had a roughly even split between the answers of 117, 118 and 119. We have had this at many stages over the course of this year and my response is always the same, first is to ask them whether this is a question that can have multiple answers, if it is then those three answers might be fine, but if not we need to agree on just one. They talked about it and came to the view that it was a question with only one answer, so the second part of this process is to have each of the groups try to convince the other that their process is correct. Whilst there was two or more answers on the table then as a group, we hadn't developed the understanding that we needed to in order to move forward. They were able to lead that conversation and the 118 group was able to successfully convince the other two groups that they had got it correct, there is a lot more power in them owning that process. Those so at the end of this we had four equations that looked very different. They were able to articulate that the operations use the same numbers but were the opposite operation (- instead of +) when you are trying to find tables rather than the chairs. This insight will serve us well as we move into solving linear equations at a later stage in the topic.
However in looking at those equations I was not yet convinced that they were in fact different representations of the same thing so I asked them "if I graphed each of these" what would I see, would I have separate lines for each equation?, would I have two different graphs?, would I have one repeated graph?" Some thought they would all be different because all the equations are different and others thought that the ones on the left would look the same and the ones on the right would look the same. plugging these into Desmos it became clear to them that they were all equivalent statementsw and they were able to articulate that they had to be the same graph because they were all representing the same problem, the same pattern. I was happy with how this went, they did really well, there was a lot of thinking here and a lot I can tap into as we build this understanding as this topic progresses. 2018 Update
0 Comments
|
Senior Leader of Pedagogical Innovation and Mathematics Coordinator in Regional South Australia.
DisclaimerOpinions in this blog are my own and do not necessarily represent the views of my employer. Archives
August 2019
Categories
All
|


 RSS Feed